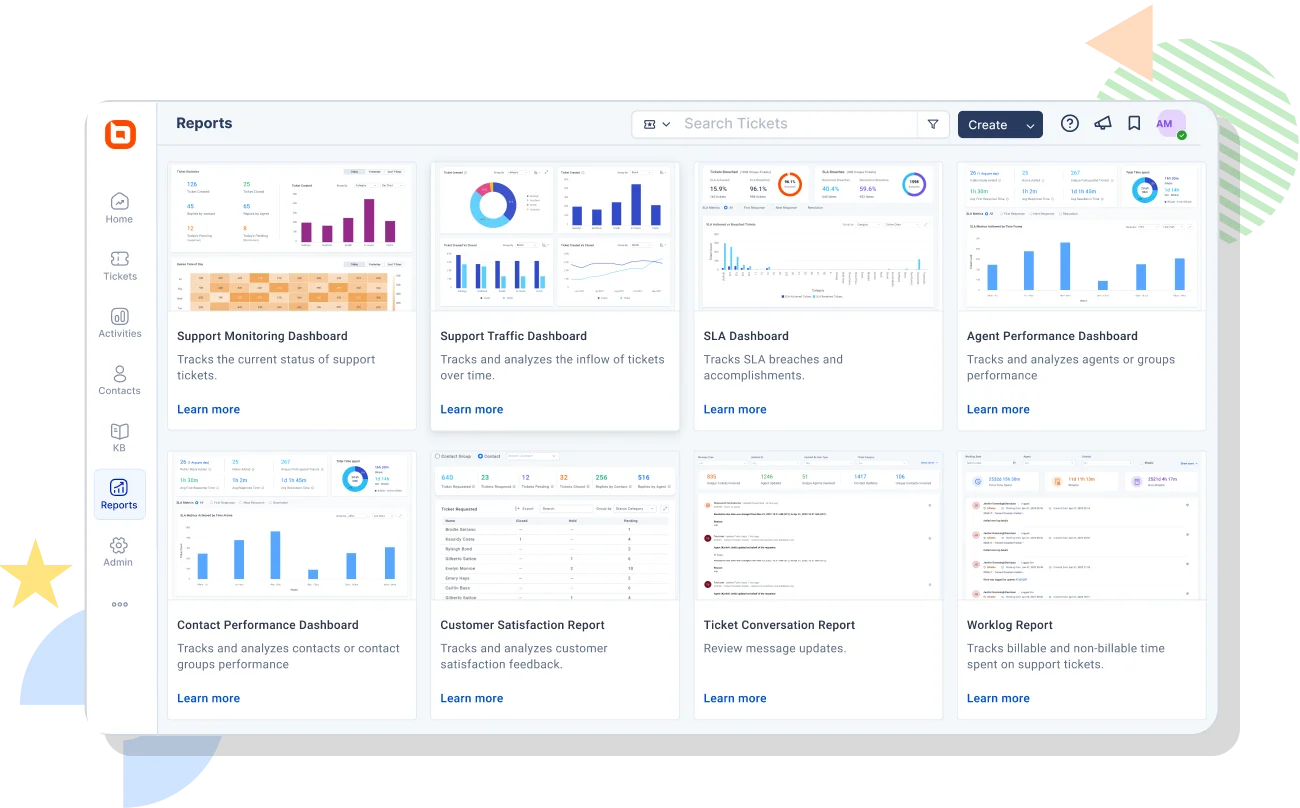
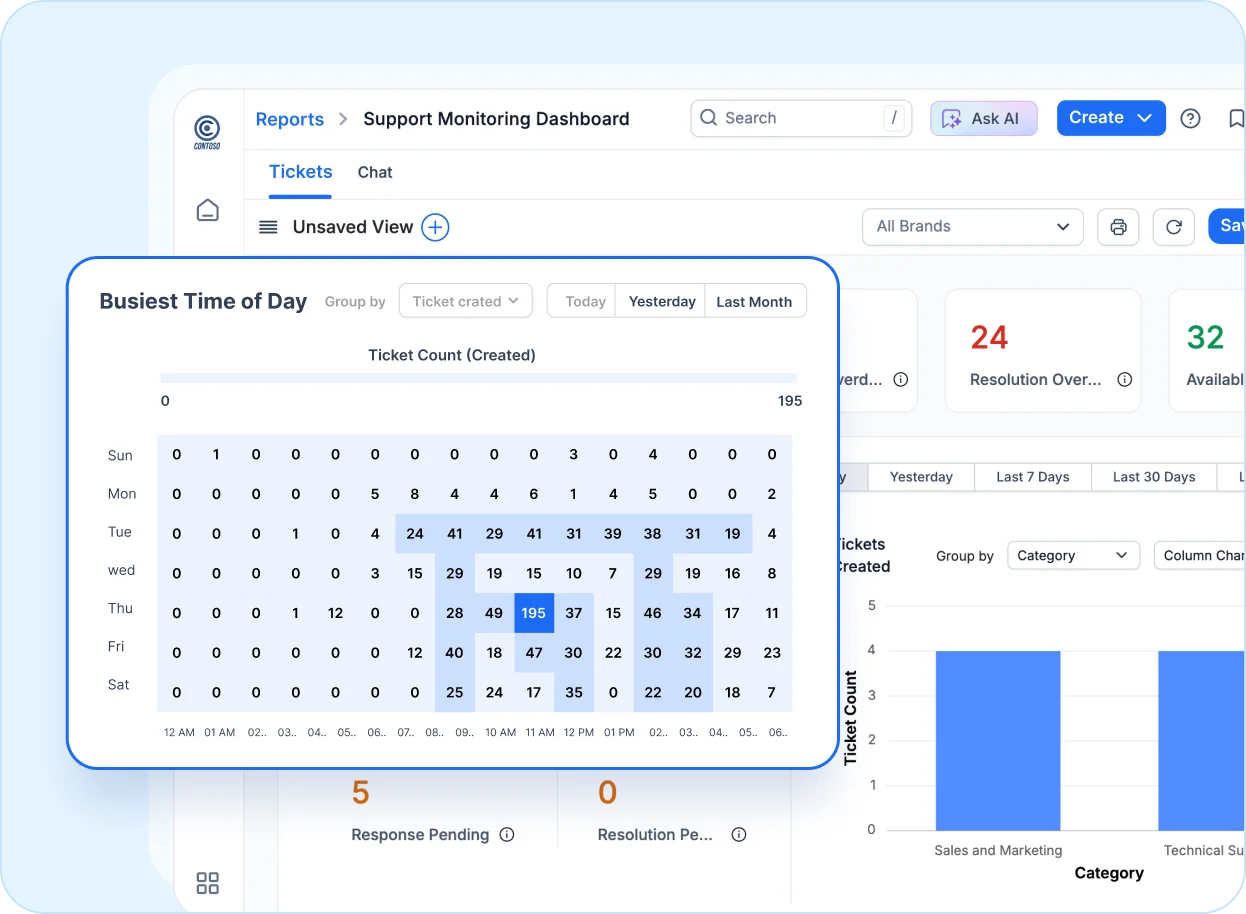
This one-stop dashboard for monitoring and tracking the status of support allows you to examine ticket inflow, track pending and overdue tickets, and determine the busiest time of day.
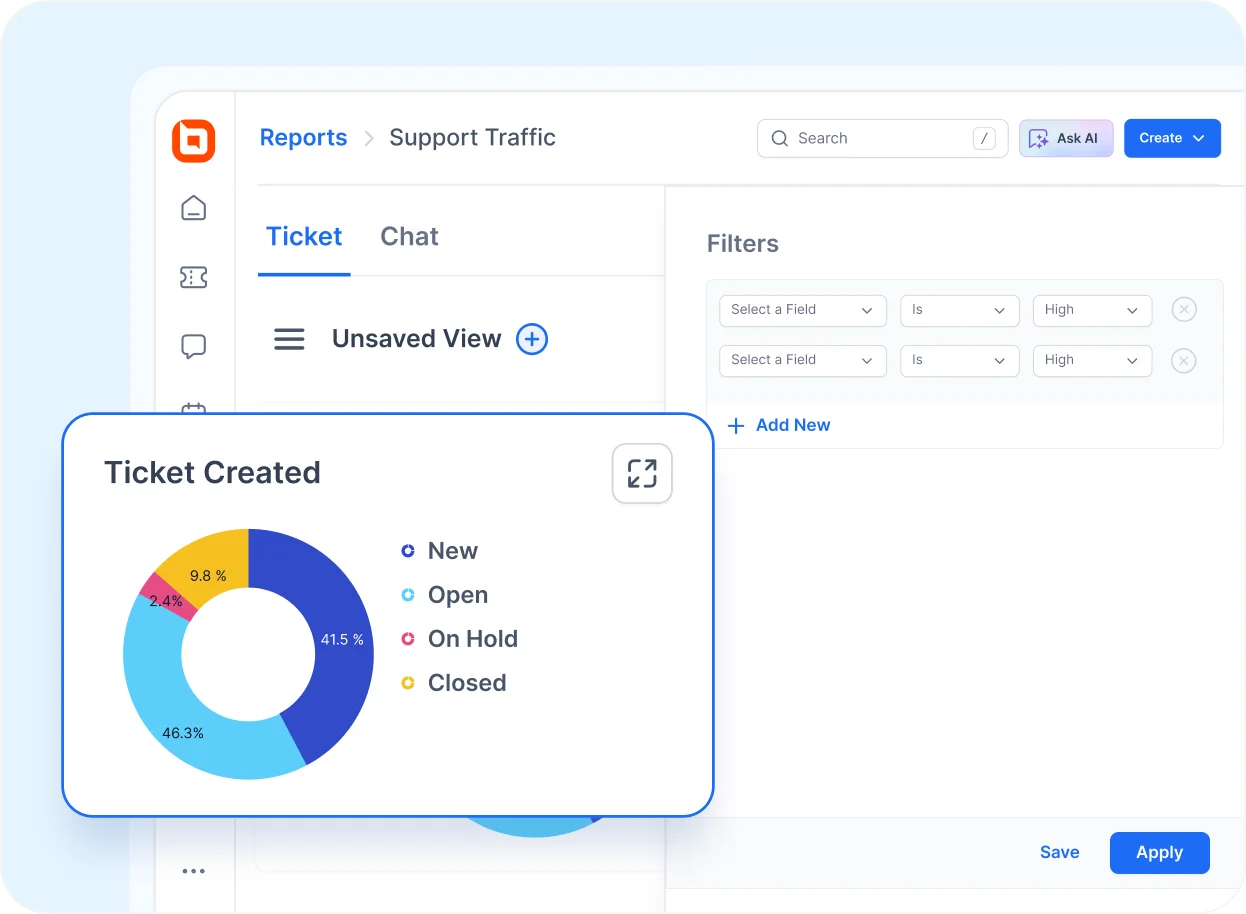
Support Traffic Dashboard
This dashboard provides metrics helpful in tracking and analyzing the inflow of tickets over time. Data can be grouped by brand, category, type, priority, status, and source. Advanced filters can be used to drill down deeper into data.
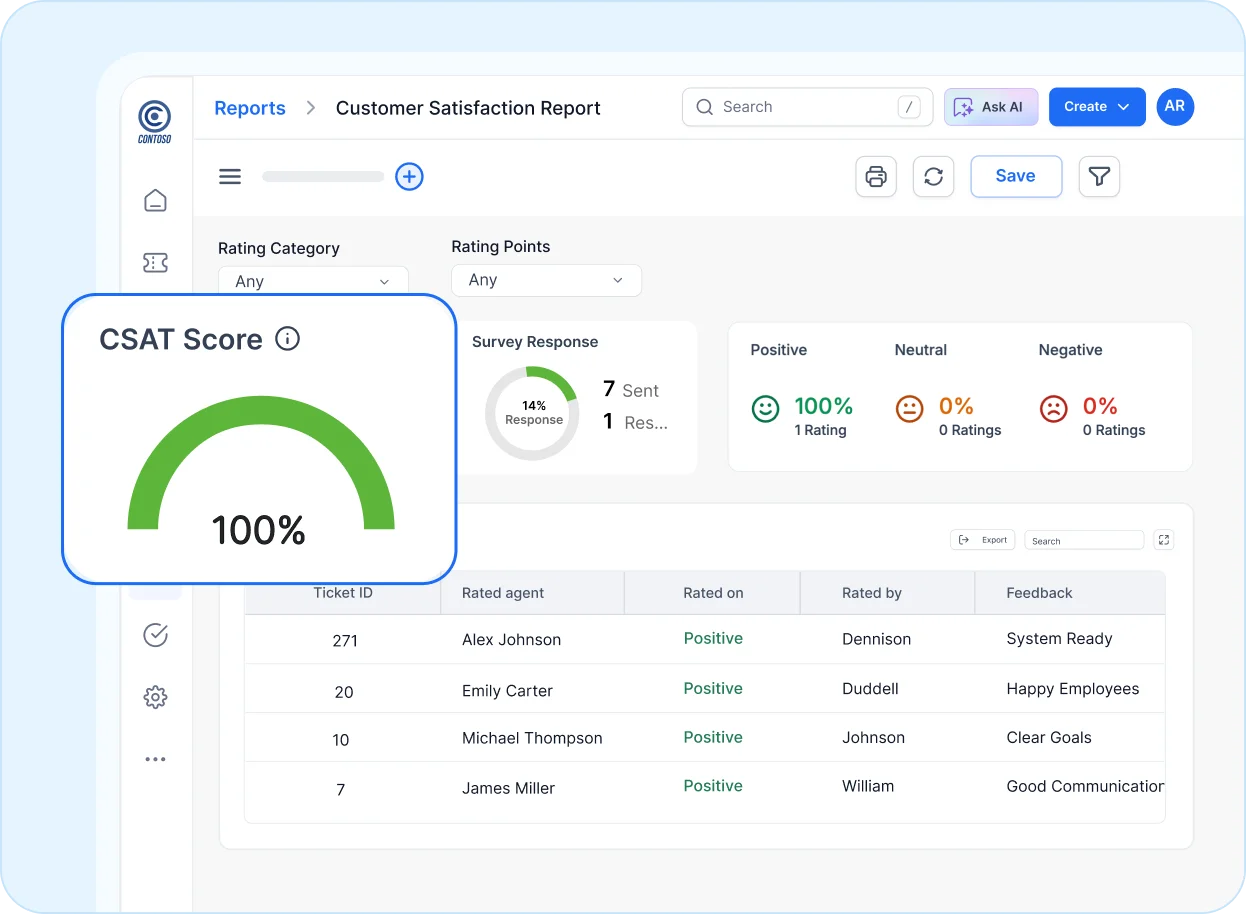
Customer Satisfaction Report
This report contains useful information about customer satisfaction surveys. View CSAT scores, survey response rates, and customer sentiment based on the provided ratings. Filters can be used to narrow down CSAT data by agent, category, contact, and contact group. Review all feedback comments from all support channels in one place.
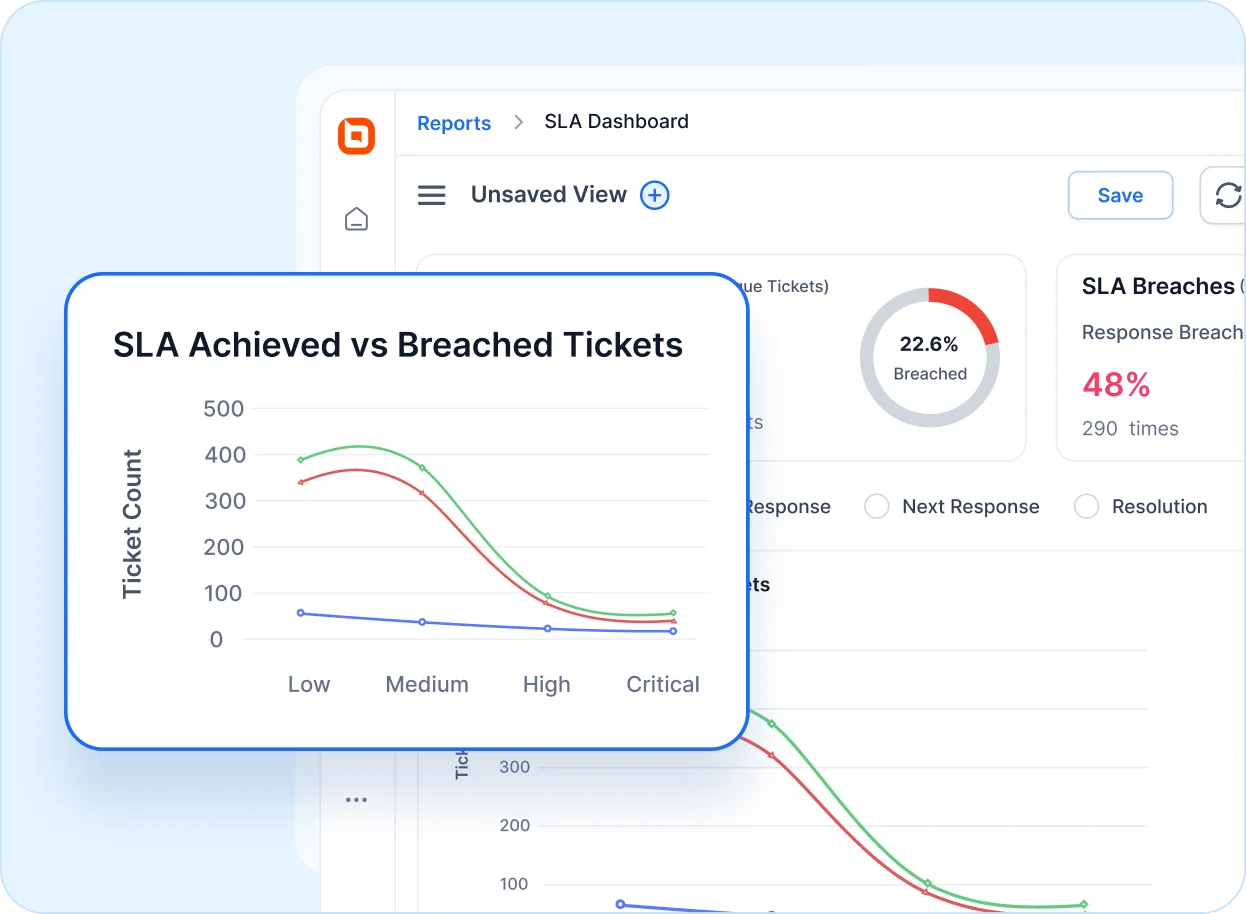
SLA Dashboard
Monitor SLA breaches and achievements in both response and resolution times with detailed trend analysis and ticket comparisons. Advanced filters allow deeper exploration of SLA performance data. With the added support for SLA Breach Escalation, automated workflows can now be triggered when SLA thresholds are breached, ensuring immediate escalation, reducing service delays, and helping maintain high service standards to improve overall customer satisfaction.
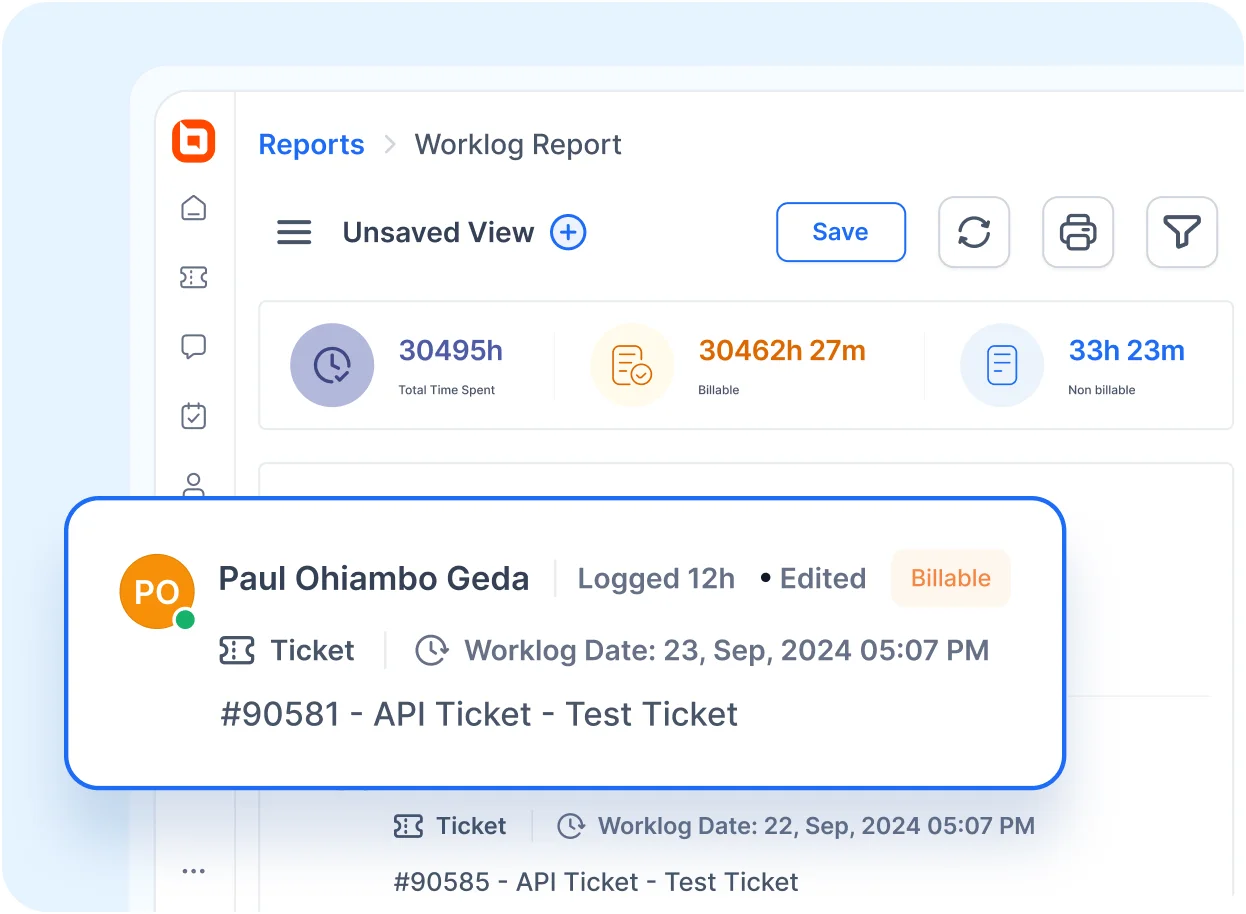
Worklog Report
Keep track of billable and non-billable time spent on support tickets by agents. Filter data based on time spent by agent, contact, contact group, and ticket category. Review worklog comments from all support channels in one place.
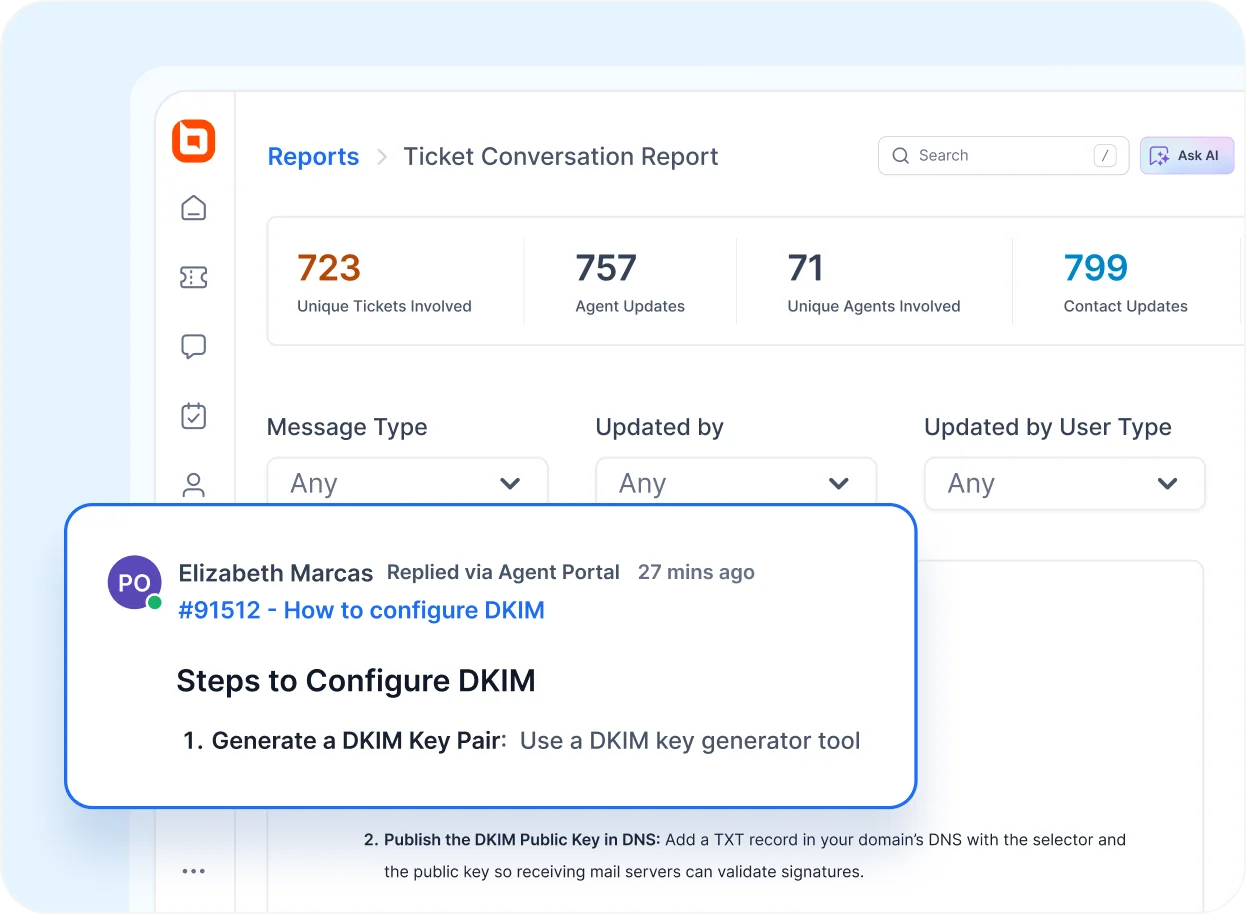
Ticket Conversation Report
Messages updated by the contact and agent across all support channels can be viewed in a single location. Examine the response provided by agents to the customer, identify agents who need more training based on the response they provided, and tag or add a private note inline for follow-up.
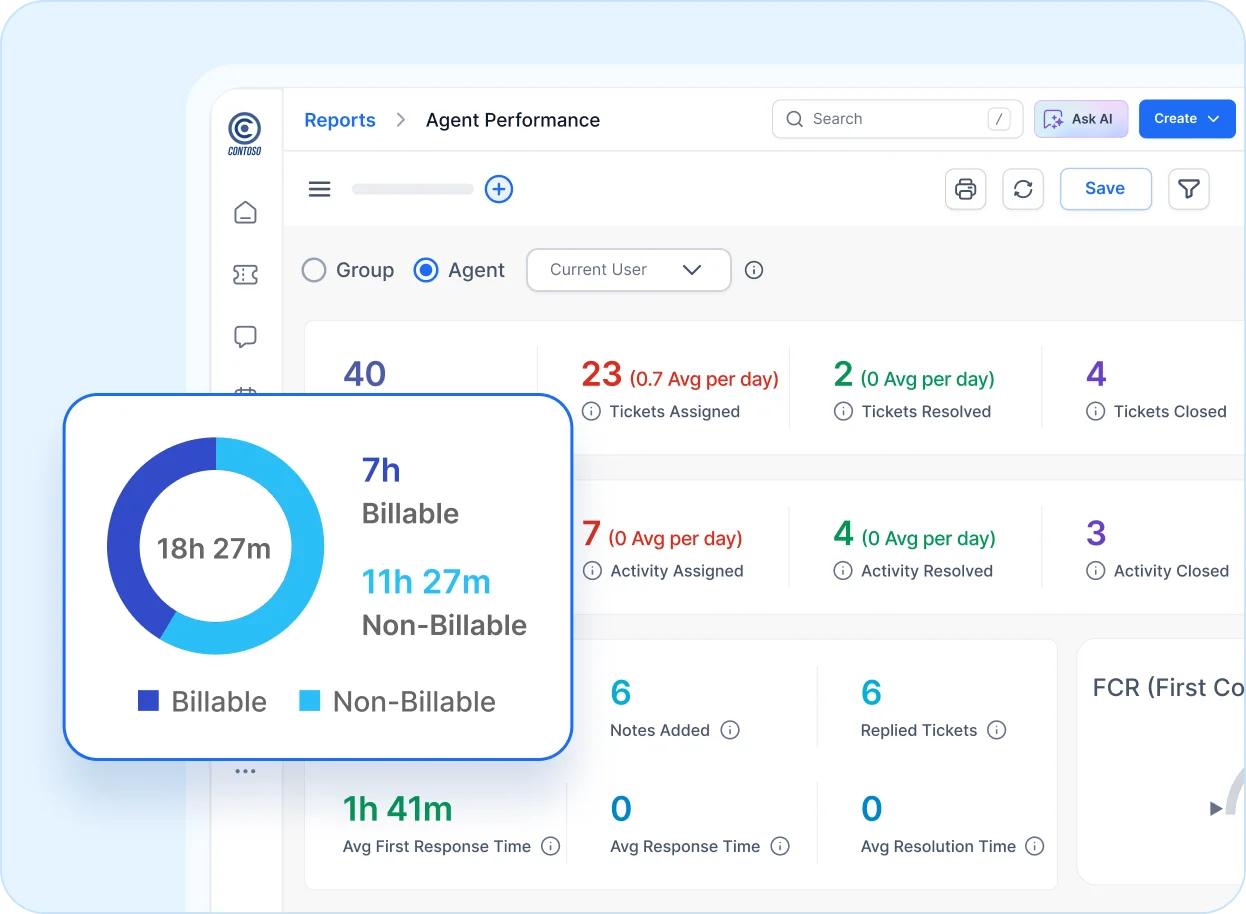
Agent Performance Dashboard
Track agent’s or group’s (team) performance with this built-in dashboard.
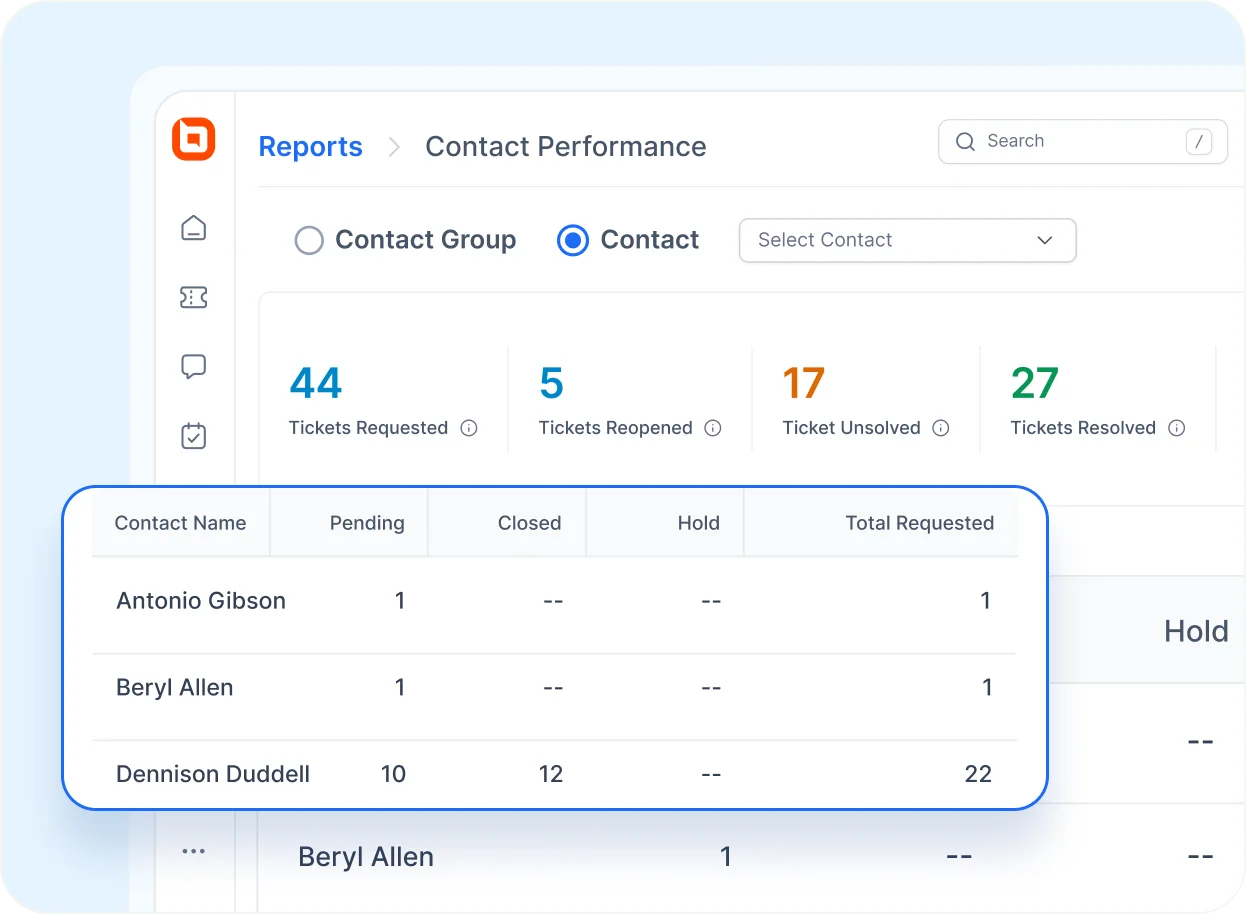
Contact and Contact Group Performance Dashboard
Monitor the performance of contacts or contact groups (companies) with this built-in dashboard.
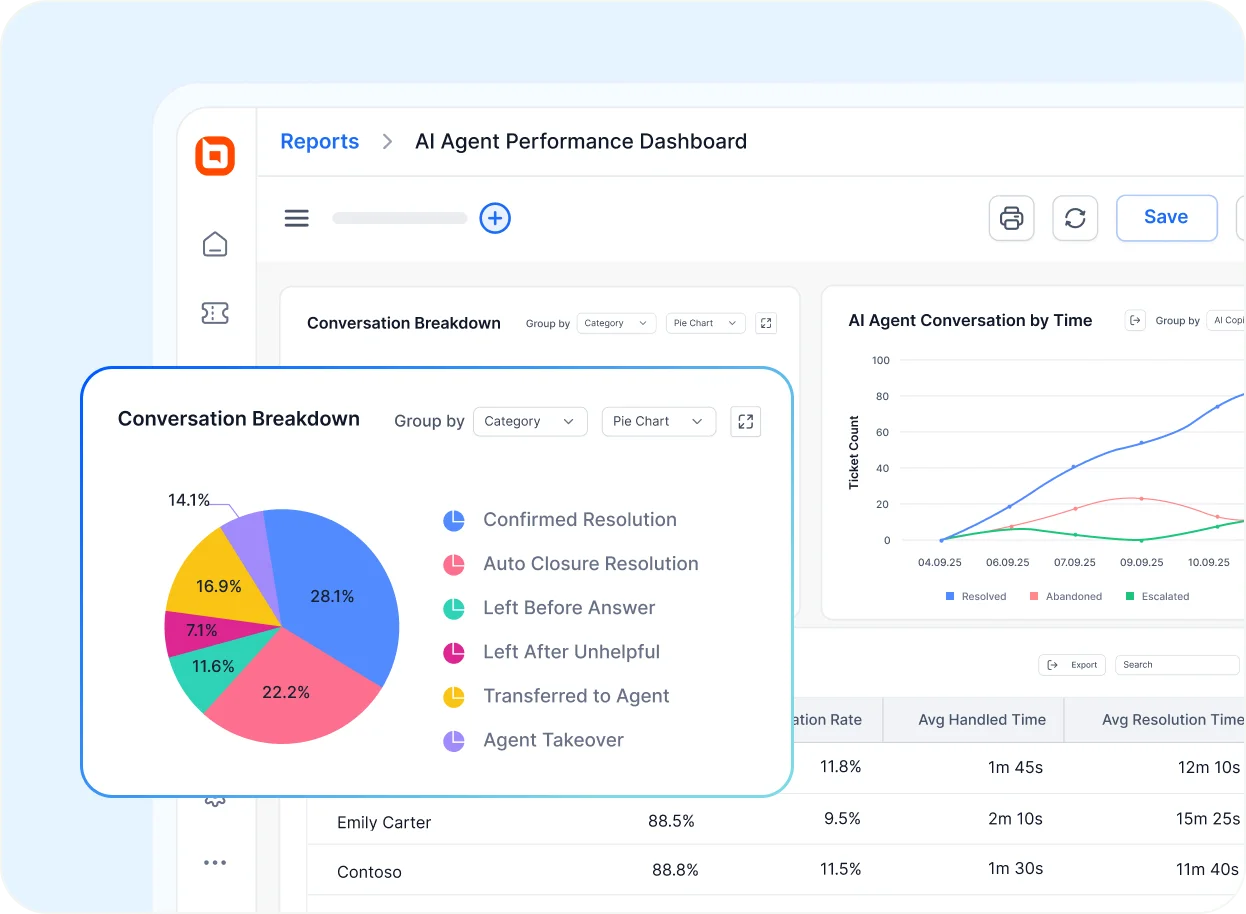
AI Performance Dashboard
Get a complete view of how AI is contributing to your support operations:
AI Usage Dashboard: Track AI activity across your team, broken down by agent and feature (AI Agent, AI Copilot, AI Action).
AI Conversation Report: Monitor conversations handled by AI, including answered and unanswered queries, for deeper performance insights.
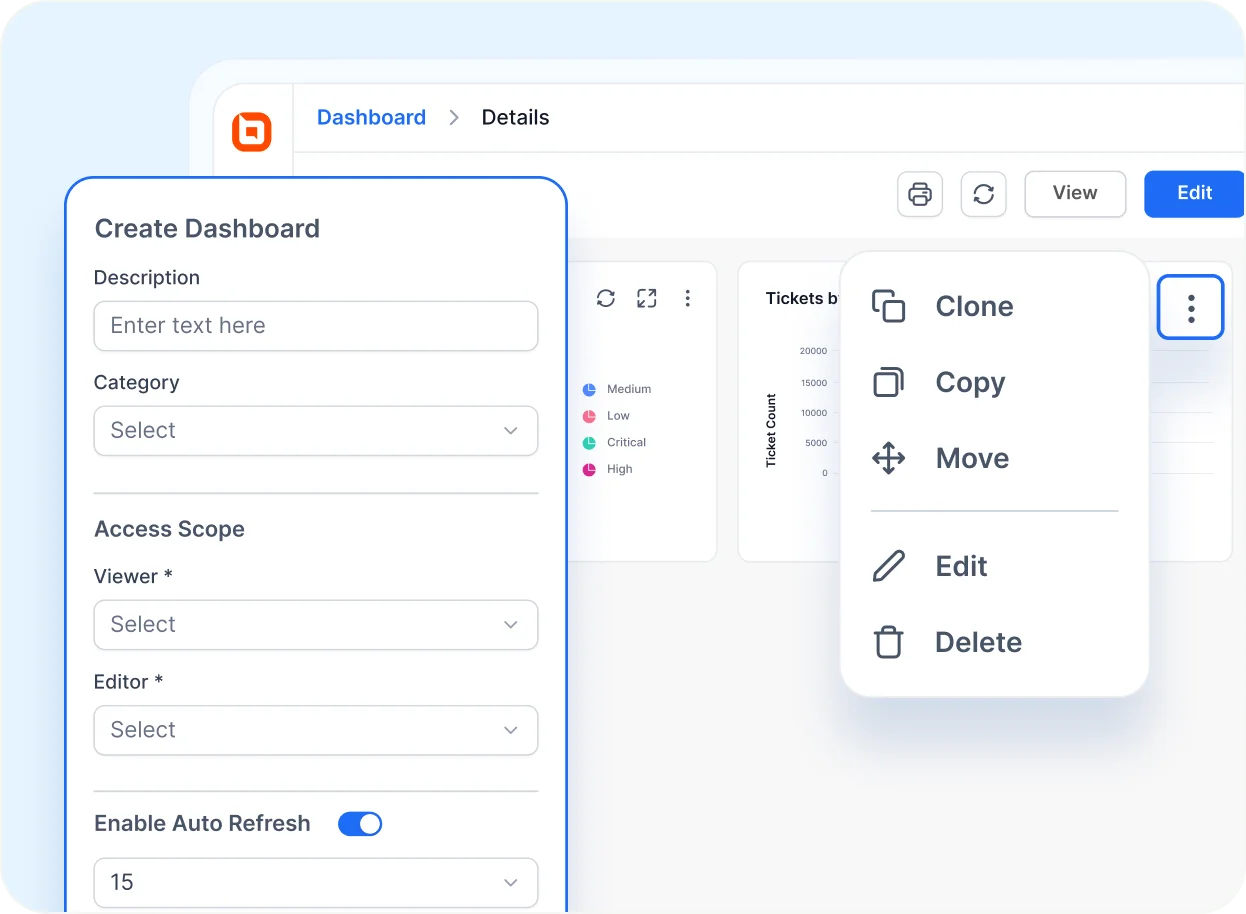
Custom Dashboard
Personalize dashboards for streamlined support and richer data visibility.